New study reveals the paths to leadership
EDITOR’S NOTE: To gain a better understanding of leadership trends in the global energy sector, Pearson Partners International analyzed the education, experience, and backgrounds of 277 chief executive officers (CEOs) from the largest publicly traded US and international oil and gas companies. Here are the results of our analysis.
This in-depth study of oil and gas leaders resulted in several noteworthy findings, including the following:
- Oil and gas CEO turnover increased significantly in 2013, compared with the previous year.
- The median tenure for oil and gas CEOs was 4.5 years, and only a small percentage of companies were led by CEOs who had served for longer than 15 years.
- The median age of large-cap oil and gas CEOs was 58, while the median age of smaller-company CEOs was 54. The median starting age of an oil and gas CEO was 50 years.
- A majority of CEOs from smaller oil and gas companies were recruited from other companies, while a majority of CEOs from larger companies were promoted from within.
- In the continuing debate about split governance, several large US oil and gas companies separated the chairman and CEO roles in 2013. However, overall, the US lags behind many other countries where a majority of oil and gas companies favor split governance.
- CEO leadership in the oil and gas sector remains virtually an all-male preserve. However, this gender gap appears to be narrowing, as more women study and work in engineering-one of the most common paths to the CEO role in oil & gas companies.
- The increase in CEO turnover, combined with a relatively short median tenure, indicates the importance of succession planning for oil and gas companies, large and small. Identifying and engaging potential CEO candidates should be an ongoing priority in companies seeking the best possible leadership talent in a competitive marketplace.
This oil and gas market sector study included US and international public companies that met the following criteria:
- Market capitalization of more than $100 million
- Independent and publicly traded (i.e., not private-equity-backed, privately held, or a national oil company)
- Fully integrated oil and gas companies (the majors) or exploration and production (E&P) companies
- Not a division of another company
- Not a pure-play refining, midstream, or chemical company, nor an oilfield equipment and service provider
Based on the above criteria, we studied 277 companies to represent a broad selection of US and international oil and gas leaders. Collectively, these CEOs manage companies that deliver more than $2.9 trillion in annual revenue and represent more than $2.7 trillion in market capitalization. In addition, they are responsible for more than 950,000 direct employees across the globe, not including contractors and consultants.
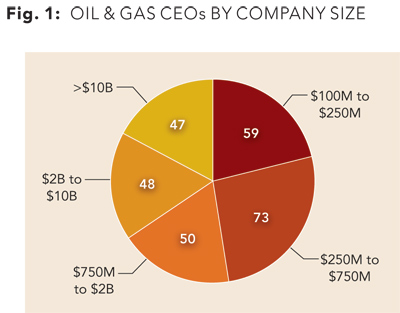
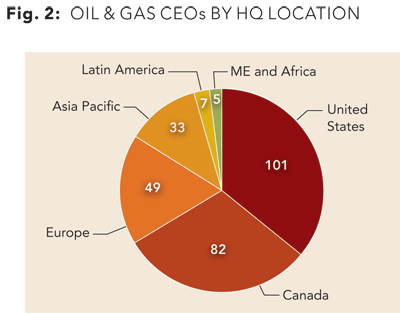
These CEOs lead companies that vary significantly in size and location. While major oil and gas companies dominate the news headlines, there are thousands of other oil and gas companies that play important roles in the energy sector. The charts below identify the number of companies included in this study by market capitalization (Fig 1) and the region of their company headquarters (Fig 2).
Study findings – CEO turnover
In 2013, there was an uptick in leadership changes in the oil and gas sector: 14% of these companies changed CEOs in 2013, compared with only 11% in 2012. Leadership changes occurred at several prominent companies such as EOG Resources, Marathon Oil, Chesapeake Energy, Encana, Murphy Oil, SandRidge Energy, Rosetta Resources, Bill Barrett Corp., and Royal Dutch Shell (Shell’s change was effective Jan. 1, 2014). However, many smaller companies also changed their CEOs last year. In fact, there was very little difference in CEO turnover comparing larger market cap (greater than $10 billion) companies with smaller market cap companies—14.9% and 13.9%, respectively. For comparison, the companies in the S&P 500 averaged an annual turnover rate of 11% from 2000 to 2013, according to a study by The Conference Board.
Study findings – CEO tenure
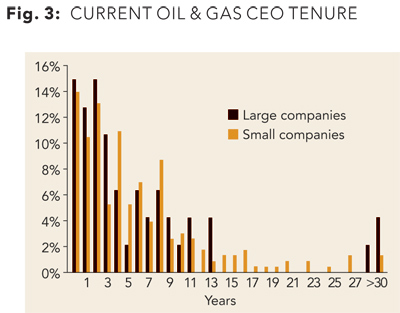
According to our study, the typical oil and gas company CEO has been in his/her role for 4.5 years. Overall, there was a wide variance in tenure (Fig 3), with about half of the CEOs having served for less than 5 years and 9% for greater than 15 years.
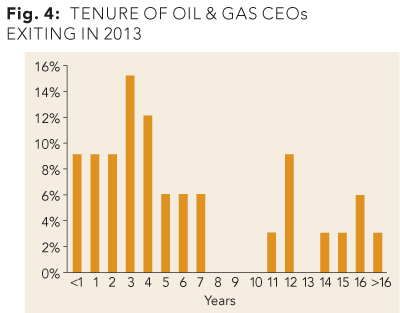
Looking at CEOs who recently left office, the result was a bi-modal distribution of tenures (Fig 4). The median of 4.8 years for this group was slightly greater than the median of the currently serving CEOs. However, there was a split between many short-serving CEOs and many long-serving CEOs, with a tenure gap in the middle.
CEO age
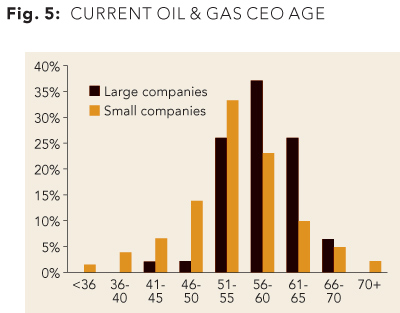
More than half (58%) of the oil and gas CEOs in our study were between the ages of 51 and 60 (Fig 5). The median age was 55, while the CEOs from the larger-market-cap companies had a median age of 58 and the median age of the smaller-company CEOs was 54.
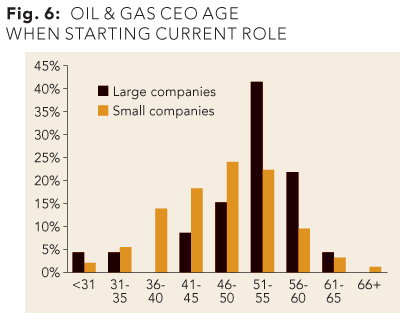
The vast majority of the CEOs in our study were promoted to CEO prior to age 56 and few became CEO at an older age (Fig 6). There was a gradual build to the peak age at which most started their current role, at 51-55 years, and subsequently a significant drop. The median age at which they started in their CEO role was 50.
CEO education
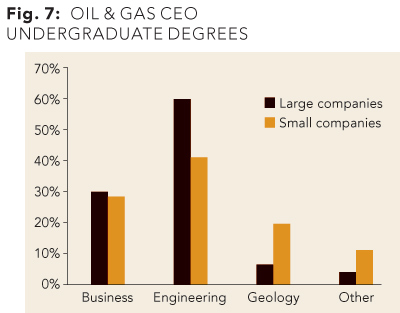
In general, the oil and gas CEOs in our study held three broad types of undergraduate degrees: business degrees (including business, accounting, finance, and economics); engineering degrees (including petroleum engineering, mechanical, electrical, civil, etc.); and earth sciences degrees (collectively described here as geology.) Figure 7 shows the distribution of CEOs by undergraduate degree, segmented by large-company CEOs and small-company CEOs.
In both the large- and small-company segments, a similar percentage of CEOs earned undergraduate degrees in a business-related field. However, a much larger percentage of smaller-company CEOs earned geology degrees, while a greater percentage of larger-company CEOs earned engineering degrees. This is not surprising, since all of the smaller companies in this study were E&P companies where knowledge of the sub-surface is usually a core competency. Therefore, it is logical that many of these E&P CEOs would possess an educational foundation in geology.
On the other hand, the larger companies in this study were a mix of fully integrated oil and gas companies as well as very large independent E&P companies. Based on the nature of these businesses, it is not surprising that almost 60% of the larger-company CEOs possessed undergraduate degrees in engineering.
Considering all the CEOs together, 44.4% earned engineering degrees, 28.6% earned degrees in fields related to business, and 17.1% earned degrees in geology (9.9% of the CEOs held other degrees).
Universities attended
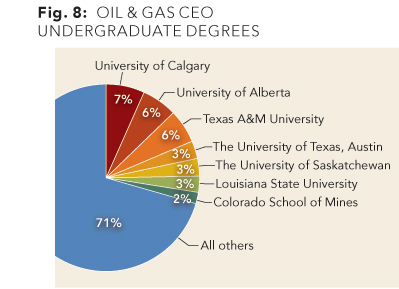
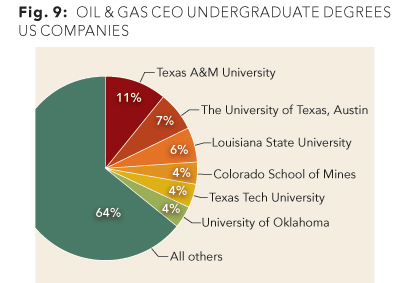
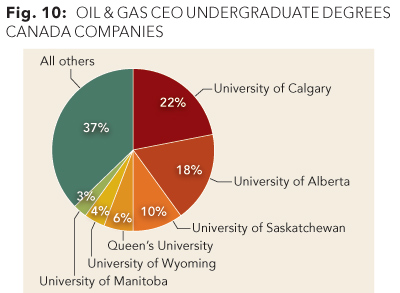
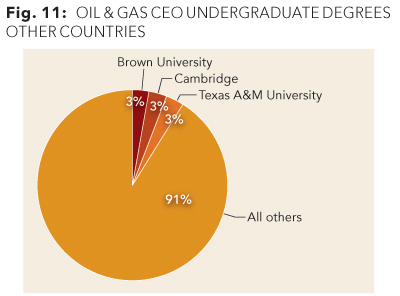
As a group, these CEOs earned their undergraduate degrees from a broad mix of public and private universities. However, the seven most commonly attended universities were public universities (Fig 8). After the top seven schools identified here, no other school had a share greater than 2% of the total.
Most of the companies located in the US were led by CEOs who attended US universities. Similarly, most of the Canadian companies were led by CEOs who attended Canadian universities. However, the Canadian CEOs had a greater concentration attending the top three schools. For CEOs from companies located in other countries, the mix was much more diverse. The top schools attended by CEOs working in each region are shown in Figure 9, Figure 10, and Figure 11.
MBAs and other advanced degrees
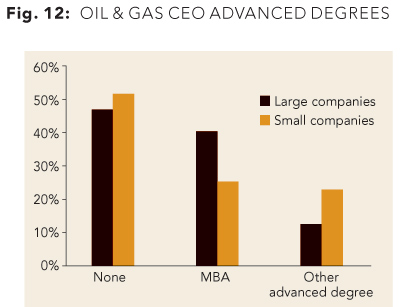
Many of the CEOs earned an advanced degree in addition to their undergraduate degree. For the entire group, just under half (49.4%) earned a graduate degree. Among CEOs from larger companies, 53.2% had an advanced degree compared with 48.5% of smaller-company CEOs (Fig 12).
Overall, 28.6% of the CEOs had earned an MBA, though a higher proportion of larger-company CEOs held MBAs. Among larger-company CEOs, 40.4% earned an MBA, while a much smaller number (25.9%) of smaller-company CEOs held an MBA.
Among the CEOs with MBAs, about twice as many held engineering or geology undergraduate degrees as degrees in business (62% vs. 28.2%.) This reflects a common oil and gas CEO career path, in which a CEO initially moves up the corporate ladder through technical roles and then transitions to more commercial roles. In these cases, the MBA degree may reinforce the experience gained in the commercial roles and also equip the CEO with the tools needed to succeed as the top leader of an enterprise.
Last stop before the corner office
There was no single path these oil and gas CEOs travelled to reach their leadership positions. However, it is enlightening to look at their roles just prior to becoming the CEO at their current companies.
In general, the positions held just before the CEO role can be categorized as follows:
- CEO of another company – Occasionally, a CEO moves from the CEO position at one company to the CEO role at another company. An example of this is Floyd Wilson, the CEO of Halcón. Before becoming the CEO of Halcón, Wilson was the CEO of Petrohawk until it was acquired by BHP Billiton.
- External promotion – This describes a person who moved from a position at one company (senior level, but not CEO) to the CEO role at another company. An example of this would be Doug Lawler, who moved from a senior vice president position at Anadarko to the CEO role at Chesapeake.
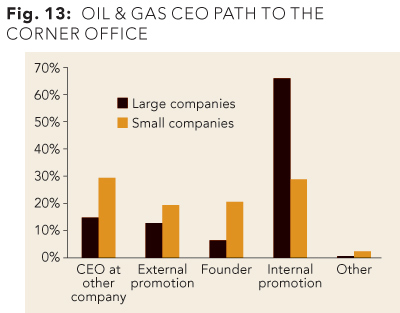
- Internal promotion – This is when a person is promoted from one position to the CEO role at the same company. An example would be Rex Tillerson, the chairman and CEO of ExxonMobil. This was the most common CEO path in larger companies.
- Founder – A number of CEOs founded or co-founded their companies, such as Harold G. Hamm, the chairman and CEO of Continental Resources.
- Other – The most common scenario in this miscellaneous category is when a board member assumes the CEO role after the departure of the previous leader. This can happen when a CEO’s departure was unexpected and the company did not have a succession plan in place. This situation occurs most often with smaller oil and gas companies.
There were significant differences between the career paths of CEOs at larger and smaller companies (Fig 13).
In larger companies, the majority (about 66%) of the CEOs were promoted from within. This is not surprising, since succession planning is usually well executed in larger enterprises, which have a broad talent pool for future leadership. However, the story was very different in smaller companies, where only 29% of the CEOs were promoted from within. This disparity could be explained by a lack of a large talent pool, a recent growth surge or a desire to change the corporate culture.
For rapidly growing companies with a smaller internal talent pool, choosing a CEO who has already successfully performed the job elsewhere is a logical choice. At larger companies, succession planning, greater stability at the management levels and a larger talent pool to draw from combine to make this option less common. Larger companies continue to recruit talented leaders at the executive level and groom them for potential leadership roles in the future.
External promotions (being promoted to CEO from a lower-level position at another company) was more common at smaller companies—19% vs. 13% at larger companies. More effective succession planning at larger companies and a greater internal talent pool make this difference understandable.
There were two common sources of CEOs promoted and recruited from other companies: 1) business unit leaders previously running a significant division as part a larger company, and 2) a functional leader at another company heading up a core function such as exploration, production, drilling, etc.
Finally, some of the CEOs of these oil and gas companies were also the founders or co-founders of their companies. This was more common with smaller companies (20%) than larger companies (6%).
Split governance
In some oil and gas companies, the CEO also serves as chairman of the board, while in other companies these roles are held by two different individuals. Recently, there has been increasing debate as to whether the chairman and the CEO positions should be held by two separate individuals. While the CEO’s primary responsibility is to manage the business, the chairman’s role is to provide management oversight through the board of directors, and like all directors, represent the interests of the shareholders. Proponents of a split-governance model argue that separating the two roles strengthens the board’s independence and oversight function. Opponents of the split-governance model say that splitting the role creates inefficiencies and undermines the CEO’s authority.
As in other industries, the boards and shareholders of oil and gas companies have been wrestling with this issue, and the trend appears to be towards a split governance model. In 2013 alone, several large oil and gas companies—including Chesapeake, Hess, Marathon, Occidental, and SandRidge—separated the CEO and chairman roles.
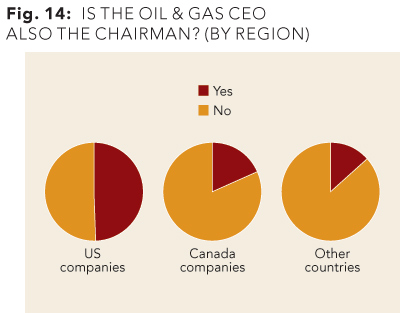
About 28% of the CEOs in this study held the combined CEO-chairman role. In the US, 50% of the CEOs served the dual CEO-chairman role, while only 18% of Canadian CEOs did. Outside the US and Canada, only 14% of oil and gas CEOs held both the CEO and the chairman title (Fig 14).
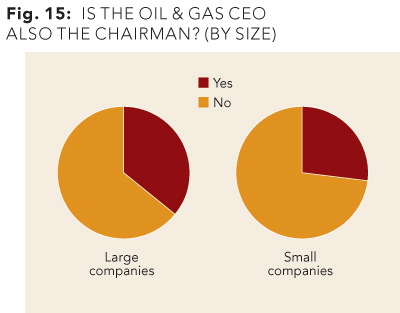
In terms of company size, 36% of the CEOs running larger oil & gas companies also served as Chairman, compared with 27% of CEOs from smaller companies (Fig 15). For comparison, about 60% of S&P 500 companies have a governance structure in which the chairman and CEO roles are held by the same individual.
Gender diversity
CEO leadership in the oil and gas sector, like in many other industries, remains a virtually all-male preserve. Almost 99% of the companies in this study were led by men, with only 1% led by women. As a matter of reference, 95% of the S&P 500 companies are led by men.
One possible reason for the low percentage of female CEOs in oil and gas companies is the dearth of women in the engineering field. According to a National Science Foundation study, in 2013 about 13% of all engineers were women. This is an increase from just 9% in 1993.
Coupling this with the fact that engineering is the most common path to the CEO role in oil and gas (Fig 7), it is not surprising that the oil and gas industry has fewer female CEOs than other industries.
The good news is that the number of female oil and gas CEOs is expected to increase over time due to a number of factors: an increased emphasis in recruiting qualified female executives, a larger talent pool as more women pursue engineering and earth sciences degrees, and increased mentorship for women in the energy sector.
Conclusions
This study points to several important conclusions:
- A sound succession plan is vital for oil and gas companies of all sizes.
- Building a large and diverse executive talent pool is essential for companies of all sizes seeking to maintain a consistent growth strategy.
- Recruiting a new leader—including a CEO of different background, gender or geographic experience—can be an important step in changing a company’s culture, creating a more diverse workplace and attracting talented leaders for the future.
- Gender diversity in the oil and gas sector appears to be improving as more women study science, technology, engineering, and math disciplines and move into engineering career paths.
- As the split-governance debate continues in the US across all industries, the oil and gas sector is increasingly separating the roles of CEO and chairman.
About the study
The information included in this profile was compiled from publicly available sources such as company web sites, press releases, and financial reports. Not all data was available for every CEO. The CEOs included in this report are those that were in place as of Jan. 1, 2014.


